Raptor:Table 1D: Difference between revisions
Jump to navigation
Jump to search
No edit summary |
No edit summary |
||
| (2 intermediate revisions by 2 users not shown) | |||
| Line 1: | Line 1: | ||
[[ | [[Raptor-Platform|Return to the main Raptor page]] | ||
[[Raptor:Table Lookup|Return to Table Lookup page]] | [[Raptor:Table Lookup|Return to Table Lookup page]] | ||
| Line 14: | Line 14: | ||
! scope="col" style="width: 15%;"|Type | ! scope="col" style="width: 15%;"|Type | ||
! scope="col" style="width: 70%;"|Description | ! scope="col" style="width: 70%;"|Description | ||
|- | |||
! X | |||
| | |||
| Value used to lookup into the X breakpoint data, and then interpolate a value from the table data. | |||
|} | |} | ||
| Line 22: | Line 26: | ||
! scope="col" style="width: 15%;"|Type | ! scope="col" style="width: 15%;"|Type | ||
! scope="col" style="width: 70%;"|Description | ! scope="col" style="width: 70%;"|Description | ||
|- | |||
! Value | |||
| Data Type | |||
| The interpolated value from a data table. | |||
|} | |} | ||
| Line 139: | Line 147: | ||
| Sets the location where the variables appears in the calibration tool. Use raptor_xcp_function(gcb) to create a function based on the variables location in the model. | | Sets the location where the variables appears in the calibration tool. Use raptor_xcp_function(gcb) to create a function based on the variables location in the model. | ||
|} | |} | ||
Latest revision as of 15:44, 14 September 2023
Return to the main Raptor page

Description
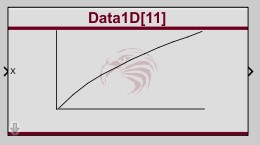
The Raptor Table 1d block is similar to the Matlab 1-D Lookup Table block. This block accepts a value and uses it to output an interpolated value from the table data and a set of breakpoint data. This is similar to the functionality obtained by using the Raptor Table Axis block and Raptor Table Interpolate 1d block. To visualize the initial data in a matlab figure, select the block and then use the raptor_visualize_table() function from the command window.
Inputs
| Input | Type | Description |
|---|---|---|
| X | Value used to lookup into the X breakpoint data, and then interpolate a value from the table data. |
Outputs
| Output | Type | Description |
|---|---|---|
| Value | Data Type | The interpolated value from a data table. |
Parameters
| Parameter | Type | Description |
|---|---|---|
| Name | String | This is the name used to store the axis data. It is also used to identify the axis in the calibration tool. |
| Table Initial Value | Matrix | This is the initial table data. |
| Table Data Type | Specifies the data type of the table data and output port. | |
| Table Storage | Specifies the storage class of the table data. | |
| Breakpoint Initial Value | Vector | This is the initial breakpoint data. |
| Breakpoint Data Type | Specifies the data type of the breakpoint data and input ports. | |
| Breakpoint Storage | Specifies the storage class of the breakpoint data. | |
| Visible in Cal Tool | Controls the visibility of the table data in the calibration tool. When the interpolate block in visible in the cal tool. | |
| Show Table Settings | Shows/Hides the calibration tool parameters for the table data. | |
| Table Gain | Number | This controls the scaling used to display the table data in the cal tool.
display value = (Gain * actual value) + Offset |
| Table Offset | Number | This controls the scaling used to display the table data in the cal tool.
display value = (Gain * actual value) + Offset |
| Table Max | Number | Sets the maximum value that can be set to any table data point in the calibration tool. |
| Table Min | Number | Sets the minimum value that can be set to any table data point in the calibration tool. |
| Table Format | Format String | Sets the display format to use for the table data in the calibration tool. |
| Table Unit Text | String | Sets the unit text that is displayed in the calibration tool. |
| Table Help Text | String | Sets the help text that is displayed in the calibration tool. |
| Show Breakpoint Settings | Shows/Hides the calibration tool parameters for the breakpoint data. | |
| Breakpoint Gain | Number | This controls the scaling used to display the breakpoint data in the cal tool.
display value = (Gain * actual value) + Offset |
| Breakpoint Offset | Number | This controls the scaling used to display the breakpoint data in the cal tool.
display value = (Gain * actual value) + Offset |
| Breakpoint Max | Number | Sets the maximum value that can be set to any breakpoint data point in the calibration tool. |
| Breakpoint Min | Number | Sets the minimum value that can be set to any x breakpoint data point in the calibration tool. |
| Breakpoint Format | Format String | Sets the display format to use for the breakpoint data in the calibration tool. |
| Breakpoint Unit Text | String | Sets the unit text that is displayed in the calibration tool. |
| Breakpoint Help Text | String | Sets the help text that is displayed in the calibration tool. |
| Access Level | Sets the access level of this item in the calibration tool. | |
| Function | String | Sets the location where the variables appears in the calibration tool. Use raptor_xcp_function(gcb) to create a function based on the variables location in the model. |