System Debug Blocks: Difference between revisions
(Created page with '===MotoHawk:Blocks:Application Monitor=== This MotoHawk® block sets up the Continuous Built-In Tests (CBIT) in every MotoHawk application. Code is generated to monitor the stac…') |
|||
| Line 6: | Line 6: | ||
Pause down counters are provided for each event in the application, which allows single- or multi-stepping of the application to debug state via display variables. Setting any one of these counters to a positive value indicates that the application should pause when all selected counters reach zero. | Pause down counters are provided for each event in the application, which allows single- or multi-stepping of the application to debug state via display variables. Setting any one of these counters to a positive value indicates that the application should pause when all selected counters reach zero. | ||
'''[http://www.neweagle.net/support/wiki/docs/Extra_Resources/ApplicationMonitor.pdf Click Here]''' to download a document explaining the use of Application Monitor as applied to MotoHawk S12 modules. The functionality remains the same across all MotoHawk controllers. | |||
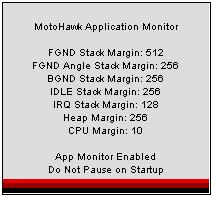
[[Image:AppMoniterBlock.JPG]] | [[Image:AppMoniterBlock.JPG]] | ||
Revision as of 13:47, 4 May 2012
MotoHawk:Blocks:Application Monitor
This MotoHawk® block sets up the Continuous Built-In Tests (CBIT) in every MotoHawk application. Code is generated to monitor the stack, heap, idle CPU usage, and OS errors. Upon discovery of a critical error, the application is stopped and certain actuators shut down safely. These currently include the Injector and Spark Sequence blocks.
In the "System | Debug | Application Monitor" section, various display variables may be used to diagnose the problem. At any time, the application is in one of four states: Init, Run, Pause, or Stop, and may be manually set from MotoTune.
Pause down counters are provided for each event in the application, which allows single- or multi-stepping of the application to debug state via display variables. Setting any one of these counters to a positive value indicates that the application should pause when all selected counters reach zero.
Click Here to download a document explaining the use of Application Monitor as applied to MotoHawk S12 modules. The functionality remains the same across all MotoHawk controllers.
MotoHawk:Blocks:Application Monitor Assertion
This MotoHawk® block provides a connection to the Application Monitor from your application. If the input to this block is true, the application will stop and report the reason and the offending block path to the application monitor. The assertion description must be unique, otherwise an error will occur. The application monitor must be enabled for this block to function as described above.
MotoHawk:Blocks:Display Debug Variables
Select whether I/O resource and other errors should be displayed in the "System | Debug" section of a MotoTune display.
MotoHawk:Blocks:Heap Used
This MotoHawk® block outputs a uint32 value from 0 to the maximum heap size as set in the Target Definition block, indicating the maximum heap used. Simply outputs 0 in simulation.
MotoHawk:Blocks:Idle CPU
This MotoHawk® block outputs a uint16 value from 0 to 65535, indicating the idle CPU usage of the module. Each count is 100/65535th of a percent (65535 = 100 %). Outputs a 0 in simulation.
MotoHawk:Blocks:Stack Free
This MotoHawk® block outputs a uint32 value from 0 to the maximum stack size as set in the Target Definition block, indicating the number of free bytes on the selected stack. Simply outputs 0 in simulation.


