Raptor-Dev-Application-Monitoring
New Eagle > Products Wiki > Raptor Platform > Raptor-Dev > Raptor-Dev Library > Raptor-Dev Application Monitoring Library

The blocks in this subsystem can be used to monitor and debug your application.
The Raptor control system application development toolchain allows for rapid development of control algorithms and produces build outputs that can be seamlessly deployed to rugged, production-validated control modules (ECUs). This system generally works well, however, every once in a while, you are reminded that you are developing in a constrained embedded environment. Inherent in this environment are limitations on the CPU throughput and memory resources. Additionally, creating software that is deployed to sealed, production ready hardware limits the ability to utilize debugging tools common in the embedded software development space, such as a JTAG debugger. Such tools allow the developer to halt CPU execution and inspect CPU state, and even step though the software source code (C files) looking for defects during execution. Thankfully, with a code-generation platform like Raptor, the types of issues that these tools are generally used to solve have been resolved already and are available in proven software blocks for you to use in your application. In reality, for a controls developer in the Raptor context, the source code is really the Simulink model and inspecting the derived (generated) C source code would not necessarily be of much value. However, due to the nature of the inherent constraints of embedded hardware, (limited processing power, limited memory, etc.) at some point, something such as a stack overflow or processor watchdog will happen as you approach these limits. In general, this would normally cause the ECU to exhibit continual or spurious processor reset or other strange behavior. When the processor resets, there is very little indication as to the cause of the error because the state of the processor is wiped on reset. Without additional tools, tracing the error can be quite difficult. This is where the Application Monitoring functionality is meant to help.
The Application Monitor performs continuous run-time checks on an executing application, monitoring key metrics and will halt the application if something goes wrong. When it stops the application, it writes an error status to some user accessible variables for inspection and leaves the calibration protocol running so you can connect to the ECU and inspect these messages to determine the issue. By halting the application before the module resets, the error state can be captured by the user using a calibration tool.
Blocks
| Block | Description | Appearance |
|---|---|---|
Application Monitor |
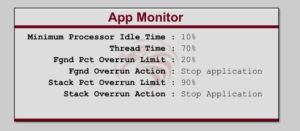
The application monitor provides a mechanism for monitoring and controlling the execution of a model on a Raptor target. The application monitor can monitor thread execution time and pause the application if a single thread's processor usage is over the defined limit or if the processor idle time is below a minimum. Adding the application monitor block to the model allows enabling additional code generation which will provide this functionality. |
 |
Application Monitor Measure |
This block causes the application monitor to pause the program when there is an input. |
 |
Application Monitor Stop |
This block allows the user to pause the application when particular criteria are met in the program. When a true is passed in the input to this block, it will cause the application monitor to pause the application. The trigger in which the stop block exists will execute to completion of the current cycle before pausing. All other triggers will pause immediately. This block requires the Raptor Application Monitor block to be in the model. |
 |
Reboot |
This block can be used to force a Raptor module to reboot. This will not execute any shutdown sequence. Typically, this block will cause the watchdog timer to trip, rebooting the processor. |
 |
Supported Versions
- Raptor 2013a_0.0.1 and later